As I mentioned on my previous post about Bike sharing Rebalancing a key question that I am trying to answer in my research is which stations of the system will be under unstable conditions, such as empty or full, for example.
To be more accurate, I am not only interested on empty or full stations, rather the exact number of bikes that each station will have in any given time of the day. Under some circumstances it is desirable to have an empty or a full station to allocate the upcoming demand pattern.
Can we anticipate when a station is going to be unstable?
The answer is yes and to do so we can use Machine Learning techniques.
Machine learning is a good fit to tackle this sort of predictive problem. Machine learning techniques explore and learn from data to build a model that can then be used as a decision making tool or to make predictions given some inputs.
In this particular problem I tested the following techniques: 1) Gradient Boosting Machines, 2) Random Forests, 3) Neural Networks and 4) Linear Regression.
The best model turn out to be Gradient Boosting Machines (GBM). GBM repeatedly fit a simple classifier, a decision tree in most of the cases, to a subset of the data, both in terms of the number of observations and the number of attributes used explain the outcome. Finally, it aggregates, or makes an ensemble of all the simpler model predictions to make a final decision.
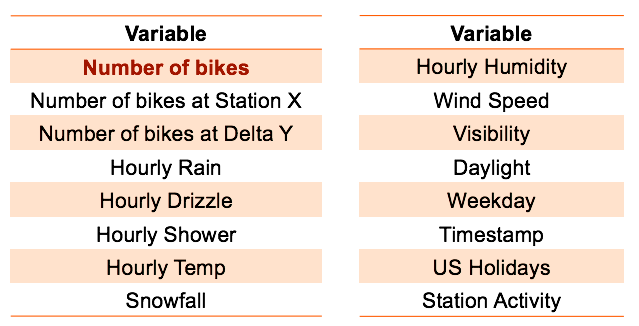
In the current problem, the outcome is the expected number of bikes in a given station and time of day and the attributes are past bike observations in that station and the surrounding ones, and weather data such as the temperature. Selecting the right attributes or features is key to achieve good performance and some of the machine learning techniques are more or less sensitive to irrelevant attributes. Below you can see the attributes that I used.

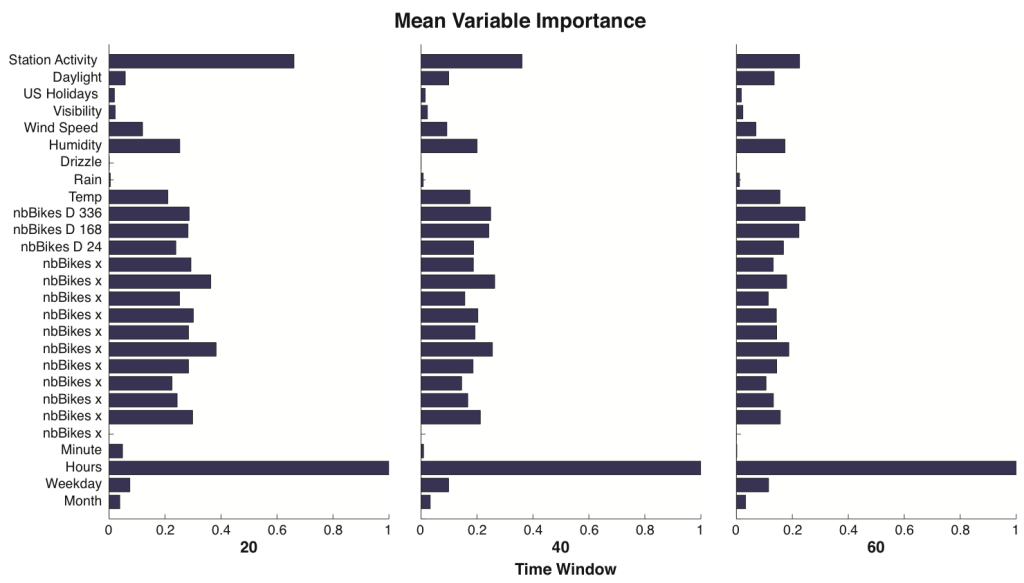
The predictions are made at 20, 40 and 60 min from the current time using data from The Hubway bikes haring system in Boston. For every station we fit a single GBM model using 3 months of historical and weather data and we test it on the last 15 days. Below we show the mean attribute importance plot aggregated over all the stations. Note, that as expected, the most important attribute is the hour of the day followed by the station activity, measured as the standard deviation of the past 6 observations.

Why is it important to make predictions?
Being able to make predictions is important because:
- The operator can make better informed decisions
- It reduces the overall repositioning costs
- It increases the system performance and user satisfaction
- We move from a reactive approach to a proactive approach
- From a mathematical perspective, we can reduce the complexity of the problem allowing for real time decision making
- It has the potential to modify riders behavior in advanced and allow for rider-based rebalancing policies (eg. suggesting a rider to get a bike from another station well in advance)
The predictions are the building block of the comprehensive framework to model the rebalancing operations of a bike sharing system that I propose.